Micro-LED Monitors Just Hit $2,000. We Measured Whether They Beat OLED
Sub-$2,000 micro-LED desktop panels have arrived. We put one on the bench beside an OLED reference and measured brightness, uniformity, near-black behaviour, colour volume, text and power.

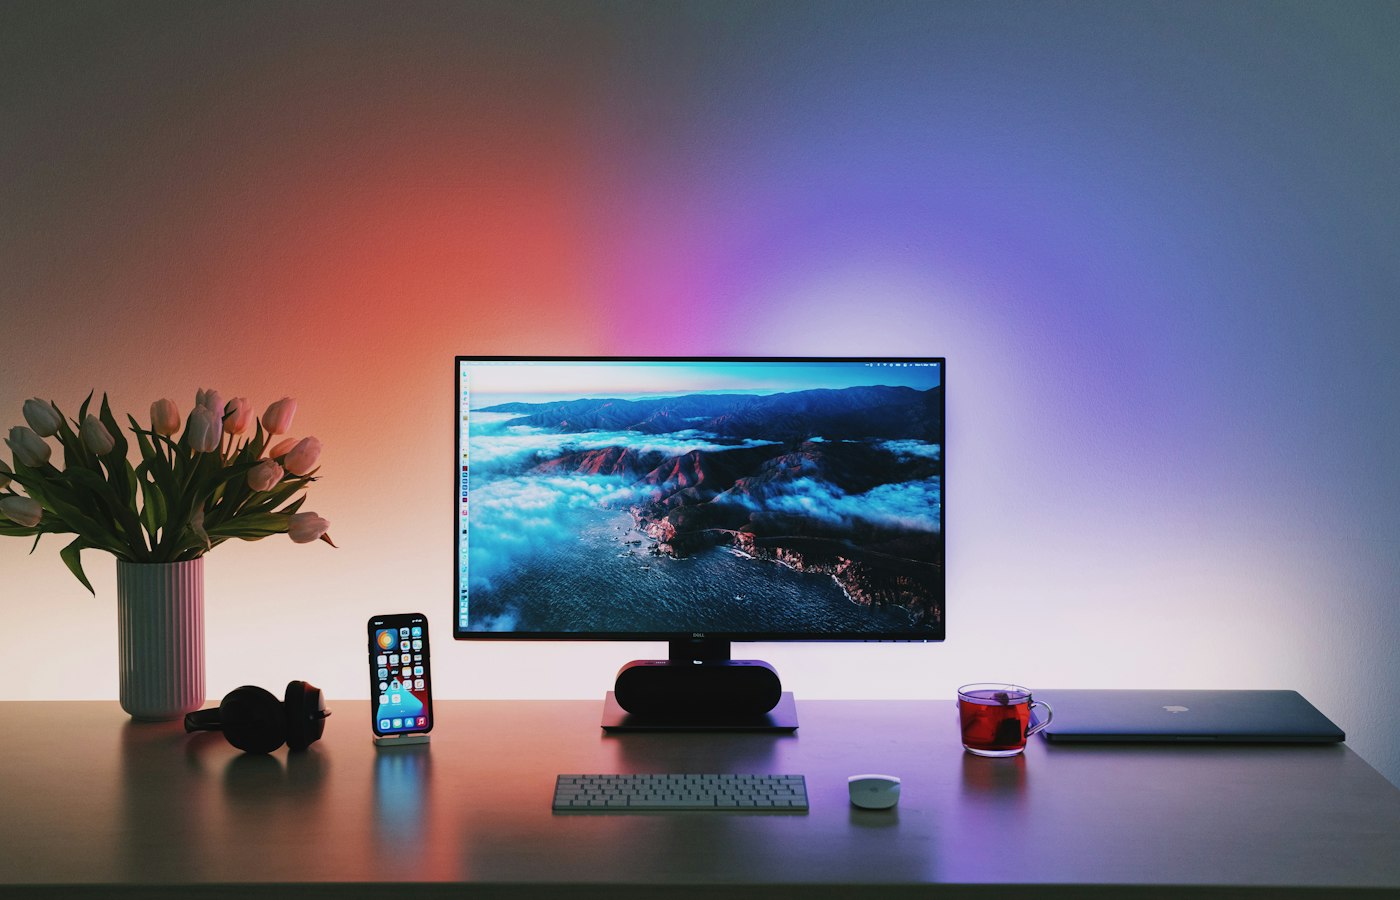
The first desktop micro-LED panels priced under $2,000 reached retail this quarter, which makes them a purchase decision rather than a trade-show curiosity. We put one 27-inch 3840x2160 micro-LED unit on the bench next to an OLED reference of the same size, resolution and pixel density, and measured the things that actually differ rather than the things marketing claims differ.
Short version: micro-LED wins sustained brightness by a margin large enough to change how you work in a bright room, loses on uniformity and near-black precision, costs more power for the same picture, and ties on the black level and blooming questions that most buyers assume separate the two. The interesting differences are not where the category positioning puts them.
Every number below is what these specific units did on this bench, under the conditions stated. They are illustrative of where the category sits today, not industry-wide benchmarks, and a first-generation mass-transfer process is precisely the situation where one sample does not predict the next one off the line. Treat the shape of the results as informative and the decimal places as anecdote.
How we measured
Absolute luminance and chromaticity came from a reference-grade spectroradiometer; a faster tristimulus colorimeter, profiled against it at the start and end of each session, handled the long pattern sequences where drift matters more than absolute accuracy. Wall power came from a logging power analyser sampling at 1 Hz, not from the monitor's own reporting.
Conditions: dark room measured below 1 lux at the screen plane, ambient 22 to 23 degrees C with no forced airflow across the panels, 30 minutes of warm-up on a mid-grey field before any reading, and both displays left at their factory-calibrated preset rather than tuned to match. HDR patterns were PQ-encoded per the BT.2100 parameter set. Pattern geometry followed the usual measurement-standard conventions: nine-point uniformity grid, ANSI checkerboard, and window patterns at 2, 10, 25, 50 and 100 percent of screen area, each held for three minutes so that thermal and brightness-limiting behaviour had time to settle.
That last detail matters more than the instrument list. A great many published brightness figures are peak readings taken in the first second of a window flash, before any limiter engages. Those numbers are real but describe a transient, and on emissive panels the transient and the steady state can differ by a factor of four.
Full-field versus window brightness
On small windows the two panels are closer than the price gap suggests. At a 10 percent centre window our micro-LED unit read about 1,860 cd/m2 sustained; the OLED reference read about 1,010 cd/m2 and held it. At 2 percent the micro-LED reached roughly 2,050 cd/m2 and the OLED about 1,150 cd/m2. Meaningful, but not transformative for most work.
Full field is where the architectures separate. The micro-LED opened near 1,410 cd/m2 and settled to roughly 1,240 cd/m2 after three minutes as its thermal management engaged, a decline of about 12 percent. The OLED reference opened near 310 cd/m2 and settled around 265 cd/m2, a decline in the same proportion but from a much lower start. In SDR the micro-LED held a 100 percent white field at roughly 600 cd/m2 indefinitely with no visible dimming as content changed.
The practical consequence is not that HDR highlights look brighter. It is that a full-screen white document in a south-facing room stays legible on one panel and does not on the other, and that automatic brightness limiting stops being a thing you notice. Anyone who has watched an OLED desktop dim as they drag a bright window from a dark background knows the artefact; it is absent here.
The micro-LED advantage is not peak highlights. It is that full-screen white stops being a compromise.
Uniformity is the current cost of the process
Across a nine-point grid at 50 percent grey, our micro-LED sample deviated by about plus or minus 7.8 percent, with the worst corner about 11 percent below centre. The OLED reference measured about plus or minus 3.1 percent. Colour uniformity showed the same ordering: corner-to-centre chromaticity differences of up to roughly 0.006 in delta u'v' on the micro-LED against about 0.002 on the OLED. On a full-screen grey field the micro-LED's variation was visible to the eye once you knew to look; on mixed content it was not.
The mechanism is structural rather than a manufacturing lapse. A micro-LED panel is an assembly of enormous numbers of individually placed emitter dies whose efficiency and wavelength vary die to die, corrected after assembly by a per-pixel calibration stored in the driver. The correction is only as good as the calibration pass and only holds while the dies age at similar rates. OLED deposits its emissive layer as a continuous film, which gives it a smoother starting point and a different failure mode.
Near black the ordering reverses in part. Our OLED reference showed faint vertical banding on a 5 percent grey field in a dark room. The micro-LED showed column-level structure at 1 percent grey, which is a driver artefact rather than an emitter one. Both are the kind of thing you see on a test pattern and rarely on real content.
Black level, blooming and the low end
This is where the expected result did not appear. Both panels are emissive with genuinely per-pixel off states, so both measured black below the reliable floor of our spectroradiometer at that level, and a 4x4 pixel white cross on black produced no measurable halo and no visible bloom on either. If you are shopping on the promise that micro-LED finally fixes blooming, note that the OLED you would otherwise buy does not have blooming to fix. That is a comparison against backlit LCD, not against OLED.
The real micro-LED weakness sits immediately above black. Driving an inorganic emitter smoothly at very low currents is hard, so panels lean on pulse-width or hybrid schemes, and quantisation shows up as crush in the first few code values. On our unit the first step reliably distinguishable from black sat near 0.02 cd/m2, and the 1 to 3 percent grey ramp was visibly coarser than on the OLED reference, which resolved those steps cleanly. In dark scenes with slow gradients this is the artefact you will notice.
Contrast ratio as a single number is useless for both. Anything divided by something at or below the instrument floor is a number about the instrument, not the display. Judge the low end by ramp behaviour and the first distinguishable step, not by a headline ratio.
Colour volume, not gamut coverage
Gamut coverage was effectively a tie: both panels covered roughly 98 to 99 percent of the DCI-P3 primaries in our measurements, which is now table stakes at this price. Coverage is a two-dimensional claim, and it conceals the difference that matters, which is how much of that gamut survives at high luminance.
Measured as colour volume, the micro-LED retained a substantially larger fraction of its P3 solid at high brightness, because it can hold the luminance at which saturated colours are being requested. On our samples the micro-LED preserved roughly three quarters of its P3 volume at a 1,000 cd/m2 reference level where the OLED preserved well under half, chiefly because the OLED's limiter pulled luminance back before saturation became the constraint. Bright saturated reds and blues are where you see this: on the OLED they desaturate towards white as the limiter engages, on the micro-LED they hold.
For SDR work at 120 to 200 cd/m2, none of this applies. Both panels tracked their targets closely enough that the difference was within the variation you would expect between two units of the same model.
Text rendering and subpixel layout
Check this before anything else if you spend your day in a terminal or an editor. Standard subpixel antialiasing on Windows assumes a horizontal red-green-blue stripe and computes per-subpixel intensities on that basis. Our micro-LED unit uses a conventional RGB stripe, so text rendered exactly as the algorithm intends: crisp stems, no fringing, no tuning required.
OLED desktop panels split by vendor class here. Stripe layouts behave like any other stripe display. The triangular and offset arrangements used by some emissive panel families do not match the assumption, and the result is coloured fringing on thin strokes, most visible on dark backgrounds with light text. The usual mitigations help without eliminating it: run at 150 percent scaling so strokes span more subpixels, switch to greyscale antialiasing where the OS allows, or increase pixel density. At the 163 ppi both of our units share, the layout is still doing visible work.
If your OLED shortlist uses a non-stripe layout and you write code for a living, look at a real editor on a real unit before buying. This is the single most common source of buyer's remorse in this category and it is entirely predictable in advance.
Power draw and the burn-in question
Micro-LED is not the efficiency story its name suggests, at least not at these die sizes. At a 200 cd/m2 mixed desktop our micro-LED unit drew about 58 W at the wall against 41 W for the OLED reference. On a full-field SDR white it drew about 96 W against 66 W. On HDR clip playback it peaked near 190 W, and the chassis was warm enough to feel. On a black desktop both fell below 20 W.
The mechanism is well documented in the device literature: external quantum efficiency of III-V emitters falls as die size shrinks, because non-radiative recombination at the etched sidewalls scales with perimeter while light output scales with area. Sidewall passivation reduces this but does not remove it, and the per-pixel driver overhead of a panel with tens of millions of individually addressed emitters is not free either. Expect a warmer desk and a louder-than-expected power figure.
On burn-in we can report a materials argument, not a measurement. Nothing on this bench tested longevity, and a week of testing cannot. The relevant point is that the organic degradation pathway that drives OLED differential ageing does not exist in an inorganic emitter, so the expected failure mode changes rather than disappearing: per-colour die degradation at different rates, with red phosphide emitters generally the least robust, and drift in the per-pixel calibration that was measured at the factory. That should be far slower than organic ageing. It is an inference from device physics and vendor claims, and it is the one part of this comparison you should treat as unverified until panels have been in the field for years.
On burn-in we can report a materials argument, not a measurement, and the distinction matters.
What to buy, and what to check on Monday
Buy micro-LED if you work in a bright room, if full-screen white legibility is a daily problem, if you grade or review HDR and need sustained rather than transient highlight luminance, or if your usage pattern is static UI for eight hours a day and you have been avoiding OLED on ageing grounds. Accept in exchange: worse uniformity, coarser low-grey steps, meaningfully higher power, and first-generation panel lottery.
Buy OLED if you work in controlled light, if dark-scene gradient handling matters more than peak output, if you want the better uniformity and the more mature process, or if the $2,000 would be better spent elsewhere. The OLED reference here was not embarrassed by the newer technology on anything except sustained brightness.
Before you commit, walk through this list with the actual unit, in your actual room.
- Subpixel layout. RGB stripe or not. Look at a real editor at your working scale, not a product page.
- Full-field white on a 30-minute timer. Watch whether it dims, and by how much, rather than trusting a peak figure.
- A 0 to 5 percent grey ramp in a dark room. Count the steps you can distinguish above black. This exposes low-end quantisation better than any contrast specification.
- A full-screen 50 percent grey field. Step back two metres and look at the corners for luminance and tint variation.
- Wall power at your normal brightness, with a cheap plug meter. Budget for the delta if your desk is already thermally marginal.
- The warranty text on uniformity and on dead or dim pixels, which is where a young assembly process shows up as a policy rather than as a specification.
Sources and further reading
- VESA DisplayHDR Performance Criteria (CTS 1.2) - test patterns for full-screen flash, small-patch peak and black level
- ITU-R Recommendation BT.2100 - Image parameter values for high dynamic range television (PQ and HLG)
- SID ICDM - Information Display Measurements Standard (IDMS), free electronic edition
- ICC RGB registry entry for DCI-P3 - primaries and white point chromaticities
- Microsoft Typography - ClearType subpixel rendering and its RGB stripe assumption
How this article was produced
Written by Priya Raghunathan and edited to the Techtrendery.com editorial policy. Figures described as illustrative are exactly that and are labelled in the text. If you find an error, tell us through the contact page — corrections are published in place with a dated note.